GSoC2019 @ LLVM

Enhancing bug reports in the Clang Static Analyzer
Kristóf Umann
Eötvös Loránd University, Hungary
Commits under GSoC
dkszelethus at gmail dot com
Introduction
This page is the final report for my GSoC 2019 project.
Motivation / Problem statement
Static analysis is a popular field of study, because it can find bugs and code smells with far greater code coverage than what is possible with dynamic analysis, though at the cost of a significantly higher false positive rate. For this reason, each report emitted by a static analysis tool has to be inspected individually and with caution. Since the human cost of this procedure is very valuable, the process of evaluating whether a report is correct should be as easy as possible. If the report is a true positive, it is also vital to provide all necessary information required to reproduce the error.
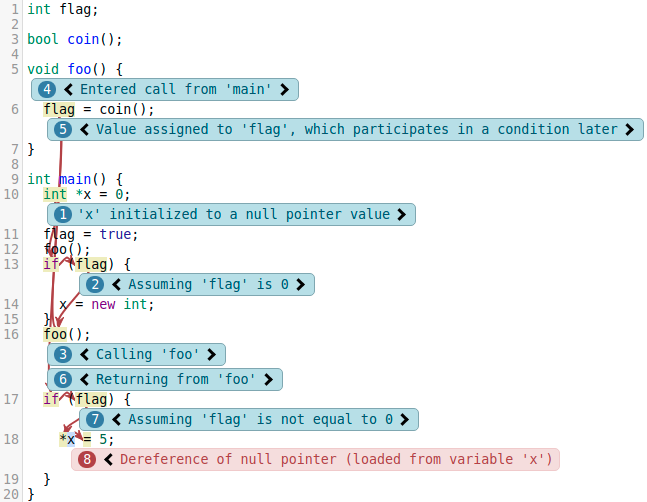
The Clang Static Analyzer unfortunately was prone to emit bug reports lacking crucial information that explained why it believed that the report was correct. The following code snippet, which will be shown in several variations demonstrates this clearly:
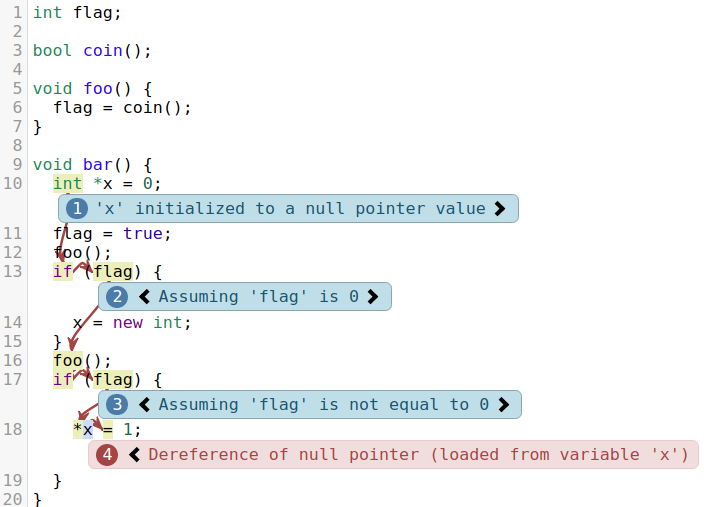
Looking only at the diagnostic messages, it isn’t obvious why assume flag’s value to be false on line 13 (we just assigned it to 1!), and even less so why we assumed it yet again to be true on line 17. Reading the rest of the code reveals why the analyzer did this, but in real-world cases where the function may lie in a header file, or the value of the condition was computed with a more complex algorithm, the problem is further amplified.
The fundamental problem here is that the analyzer doesn’t realize the importance of these conditions, and chooses not to explain them any further.
The structure of the final report
This final report will explain the research and development process that lead to the improvement of these cases, putting emphasis on examples, rather then the proving of algorithms or minor details.
First, we’ll talk about the control flow graph (CFG), dominance, postdominance and control dependence. Then we’ll discuss the main technique used by the analyzer to explain values: tracking. The formal part of this document will be concluded by showing how the combination of control dependency calculation combined with value tracking could improve on the above shown test case.
The second part of the report will talk about the implementation process, complemented by links to discussions and patch reviews.
The document is concluded with select examples of bug reports on large open source projects, where control dependency tracking made significant improvement, as well as what work is still left to be done.
I invite you to skip the first part of this report if you’re only interested in the implementation and results.
Special thanks
I want to express my gratitude towards everyone that helped me on this project, but especially to 3 individuals: My mentors, Artem Dergachev and Gábor Horváth, and my good friend Ádám Balogh. I got to skype with them every week, received response to my mails and patches often within the hour, in some cases even during weekend days! They not only helped me on this project, but encouraged me, treated me with respect and made me feel like my work is important. I am humbled by the countless hours and genuine effort they invested into this.
Thank you.
I also want to thank Jakub Kuderski for going out of his way to help me on the LLVM side changes, which was a source of great worry on my end before I started coding, and Zoltán Porkoláb for always being around to talk with about the intricacies of C++ and some algorithms.
Research
The static analysis happens after Clang already parsed the source code and created the abstract syntax tree and the control flow graph s for it. This, along with the information the analyzer itself gathered are used to construct a bug report.
Control flow graphs
Control flow graphs, or CFGs for short are all operations performed by the program, arranged in the order in which they are performed. Every operation (eg., statement) appears in the CFG exactly once and a directed edge between two operations says that the to-operation may be executed after the from-operation. Sequences of operations that are always executed sequentially are traditionally combined into nodes, which we call basic blocks or CFGBlocks.
For example, for function main in the above mentioned test case, the following CFG will be generated:
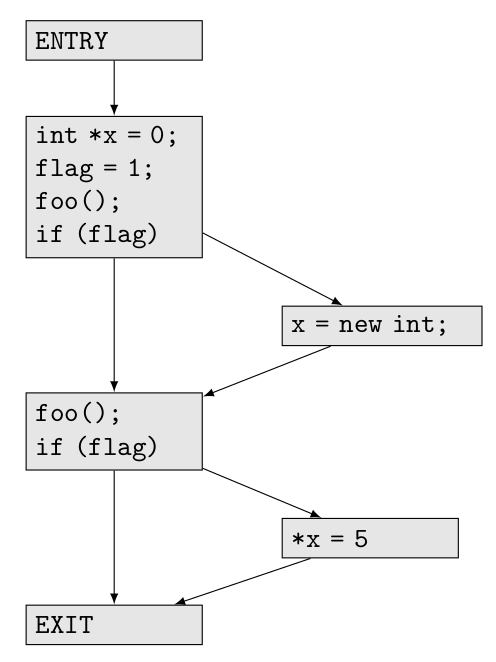
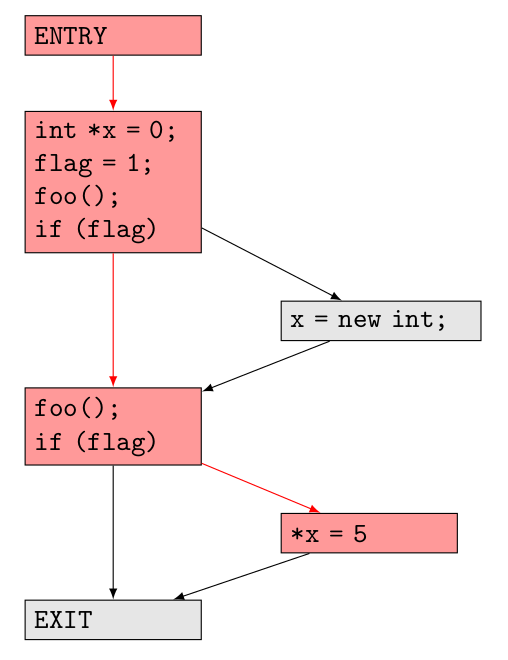
You can see the blocks and arrows in red that show the particular path of execution that leads to a null pointer dereference error.
Dominance and postdominance
We say that block A in a CFG dominates block B, if every path from the entry block to B must go through A. We say A strictly dominates B, if A dominates B and A isn’t equal to B.
Postdominance works similarly, but the other way around: We say B postdominates A, if every path from A to the exit block must go through B, and again, similarly, B strictly post dominates A if B postdominates A and B isn’t equal to A.
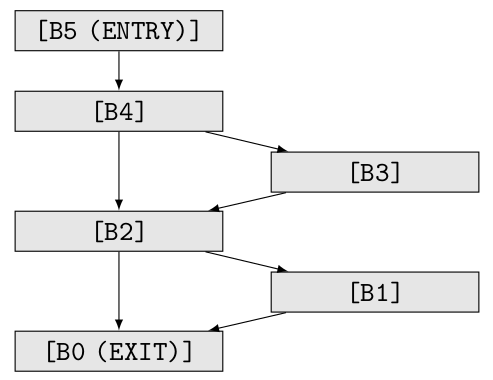
For following CFG (isomorphic to the ones shown above), the entry block (strictly) dominates every (other) block, and the exit block (strictly) postdominates every (other) block. B4 dominates B3, but B3 doesn’t dominate B2, since the path B5 -> B4 -> B2 excludes B3. B2 postdominates B4, but B3 doesn’t postdominate B4.
Control dependence
The formal definition states that block B is control dependent on block A if there exists an edge from A to C such that B postdominates C, and if B isn’t equal to C, B doesn’t postdominate A. Less precisely we would say that B is control dependent on A if B doesn’t postdominate A, but does all blocks in between them. Even less precisely, we could say that B is control dependent on A, if whether control reaches B depends on the condition value in A.
For the following function:
int test4() {
  int y = 3;
  while (y > 0) {
    if (y < 3) {
      while (y > 0)
        y++;
    } else {
      while (y < 10)
        y++;
    }
  }
  return 0;
}
The following CFG would be generated by Clang – note that some of the blocks are auxilary, such as B2, B6 and B3.
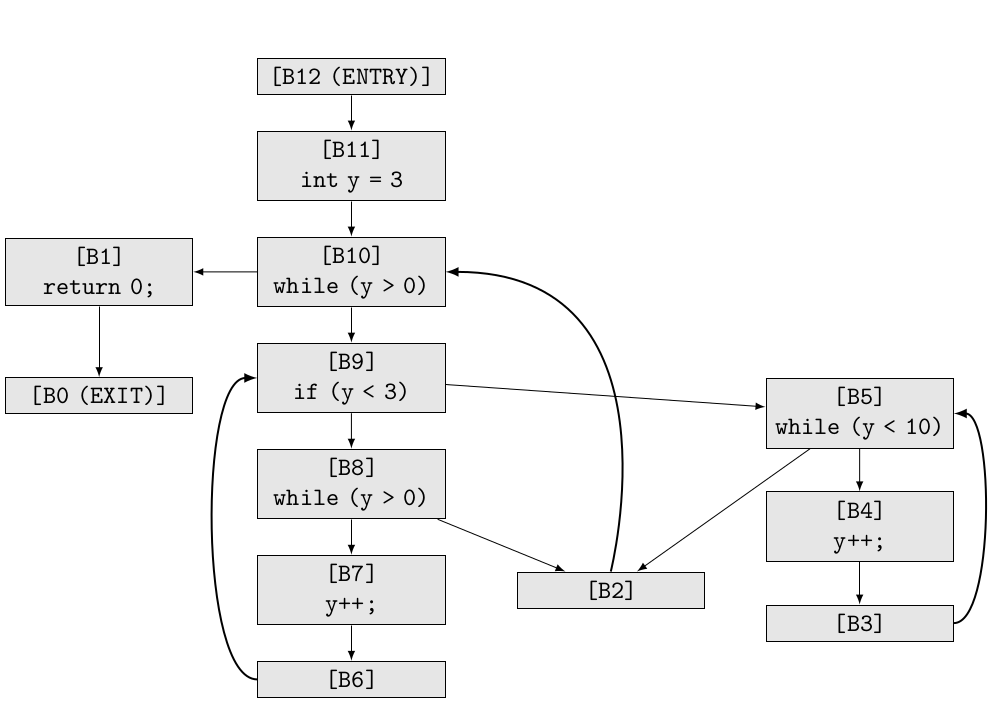
B8 is a control dependent on B10 for instance, because there exists an edge from B10 to B9, which post dominates B8, and B8 doesn’t postdominate B10. B10 isn’t a control dependency of B1, because B1 postdominates B10. B2 isn’t a control dependency of any of the blocks, because the only outgoing edge of B2 is to B10, and B10 postdominates it. B8, B7 and B6 are all control dependent on B9, and B4, B3 are control dependent on B5.
Value tracking
During analysis, the analyzer will construct a so called ExplodedGraph that contains every execution path it explored. This isn’t the same as the CFG, because it contains far more information (assumptions on values, memory regions). It isn’t even isomorphic with it, because, for instance, a path of execution on which the body of a loop is visited 4 times, it would be represented with a linear path, rather then a directed loop. Also, while a CFG is built for each function, only a single ExplodedGraph is built for the entire analysis.
The ExplodedGraph does have a natural projection to the CFG representation though: Each node (ExplodedNode) in it can be mapped to a CFGElement in a CFGBlock, and edges of the ExplodedGraph can be mapped to edges in between CFGElements.
The following is a heavily simplified example of an ExplodedGraph made from the first test case. You can see the node filled with red as an error node.
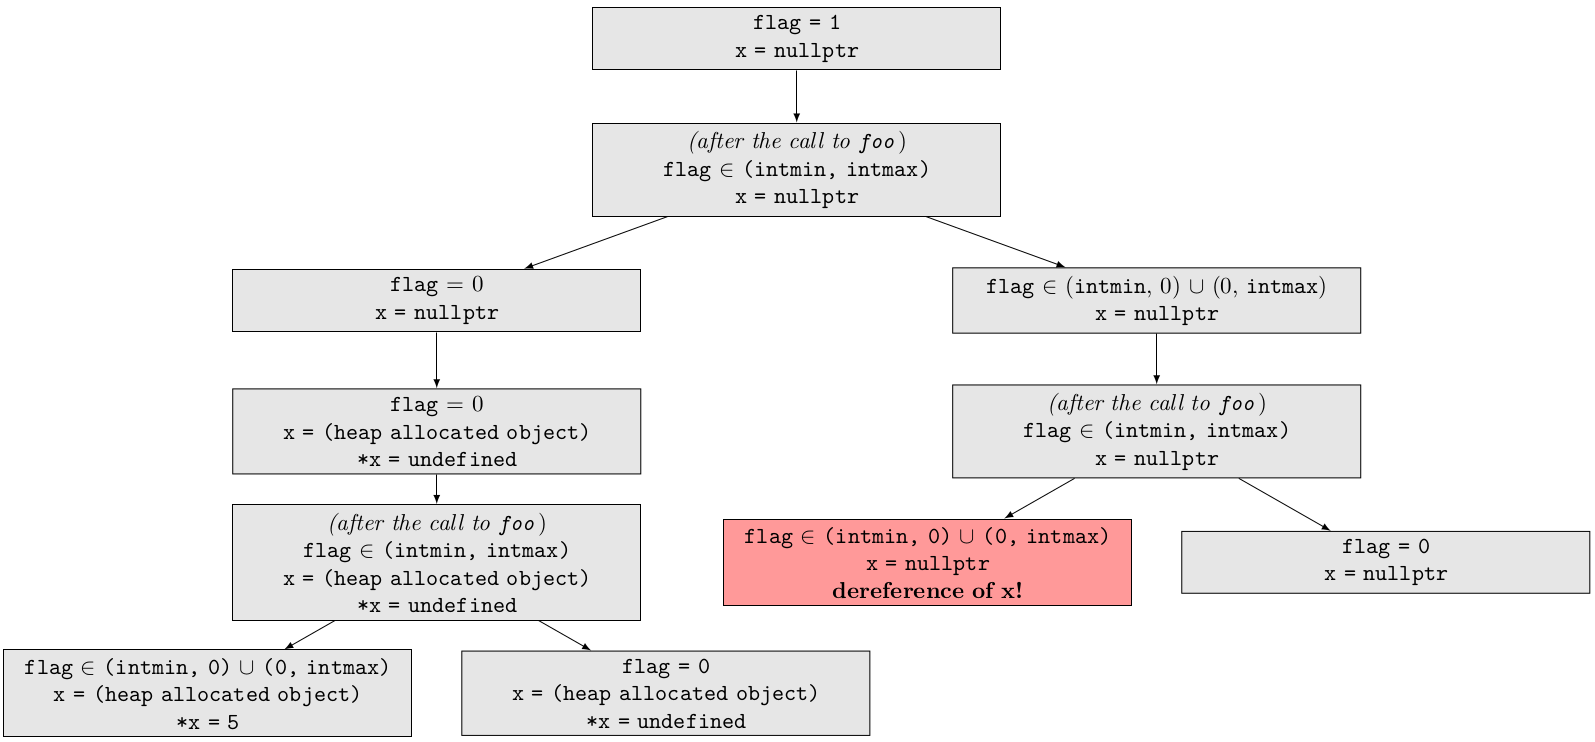
Note how the path leading to it from the root (which we will call a bug path) isn’t red: after the analysis comes the diagnostics construction as a completely different phase, and finding the shortest path to the error node is a part of this process.
This implies that diagnostics construction is more than printing to a file or the console, in fact a variety of algorithms are used at this stage to explain why and how did the analyzer take this particular path of execution, why it believes certain expression to hold a certain value, and so on.
The main technique used for this is expression value tracking: the analyzer marks the value interesting, registers so called visitors that visit each node of the bug path, constructing a diagnostic message if something happens in that node to an interesting value. Due to the information that is found in the bug path, this makes it easy to reason about data dependencies.
For the following example, we can see that dividing with a will result in a division-by-zero error. During the analysis, after discovering this error, the analyzer will mark a as having to be tracked. After that, when the bug path is processed into a bug report, we will find a node in which a is assigned, so we’ll track the right hand side of that assignment. Later in another node we’ll see that b’s value is constrained to be 0 (at the condition point), so we can place a diagnostic message there.
void f(int b) {
  if (!b) {
    int a = b;
    10 / a;
  }
}
Conclusion to the research: compliment data dependency analysis with control dependency analysis
Originally, I wanted to solve this problem by implementing a program slicing algorithm. However, after countless mails on the mailing list and skype meetings with my mentors, we came up with a better (and more realistically implementable) solution.
Without getting into the details, program slicing works by “slicing away” parts of a program not relevant to a specific statement’s value. The main idea used by the algorithm is a combination of data and control dependency analysis, and since the analyzer already implements the former, adding the latter sounds like a step in the right direction. We planned to track the condition expressions of control dependency blocks to the basic block associated with the error node.
For example, the error node would be on line 18 in this case. The basic block associated with it is control dependent on the condition (flag) on line 17, so we could track it, which would make the analyzer explain its value, adding nodes to the function call on line 16.
(You may notice that we complained about line 13 not being explained well enough, yet this trick doesn’t solve this problem. We’ll return to this later.)
Implementation
Stage 1.: Control dependency calculation
Since LLVM is (in part) an optimizer, it houses plenty of CFG algorithm implementations, and one of them is an iterated dominance frontier calculator, which can be used to find control dependencies. My first task was to generalize this code to be used with not only LLVM’s own CFG, but Clang’s CFG as well. This wasn’t as easy as it sounds however: LLVM’s CFG contains no null pointers, while Clang uses null pointers to indicate that a given successor is unreachable.
Skipping null pointers isn’t difficult conceptually, but as a performance critical project used by tens of thousands of developers, I needed to find a solution that has no runtime overhead and doesn’t disrupt the algorithm with too much code.
Discussion
- [llvm-dev] [IDF][analyzer] Generalizing IDFCalculator to be used for Clang’s CFG
- [cfe-dev] [analyzer] Rough sketch of the algorithm for “Enhancing bug reporting with static backward program slicing”
Patches
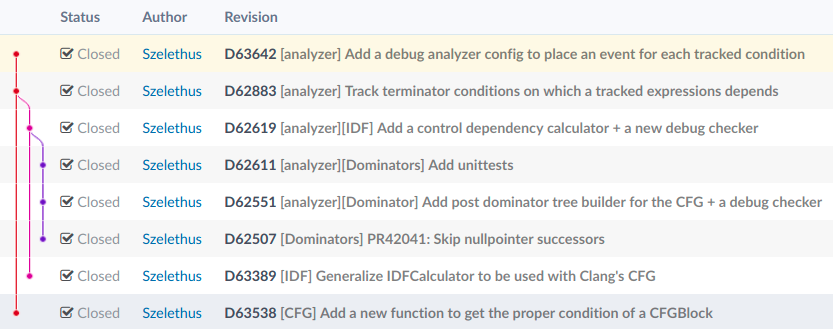
- D63538: [CFG] Add a new function to get the proper condition of a CFGBlock
- D63389: [IDF] Generalize IDFCalculator to be used with Clang’s CFG
- D62507: [Dominators] PR42041: Skip nullpointer successors
- D62551: [analyzer][Dominator] Add post dominator tree builder for the CFG + a debug checker
- D62611: [analyzer][Dominators] Add unittests
- D62619: [analyzer][IDF] Add a control dependency calculator + a new debug checker
- D62883: [analyzer] Track terminator conditions on which a tracked expressions depends
- D63642: [analyzer] Add a debug analyzer config to place an event for each tracked condition
Stage 2.: Evaluation, refinements
Adding a functionality like this cannot be judged purely on CFG graphs drawn on a piece of paper, so I spent plenty of time with evaluation. This was done by running a patched version of the analyzer on large, open-source projects.
Luckily, no crashes or assertion failures plagued this process so much, though it was very quickly discovered that the increase in the amout of notes in bug reports that changed was intolerable (such as jumping from ~30 notes to ~70, or in the most extreme case, from ~10 to ~170). So I spent a good amount of time coming up with heuristics to tone down on the notes explaining conditions, and gathering feedback about it on the mailing list.
Accompanied with my mentors suggestions I formalized the following improvements:
- Don’t track the condition of asserts.
- Since the user can always read the function the error node resides in, only mention events in nested function calls.
- Prune diagnostic messages about functions only consisting of 3 CFG blocks.
I implemented these as well, though didn’t commit the changes in order to give enough time to everyone wanting to chip in.
Discussion
[cfe-dev] [analyzer] Tracking values for generating bug reports
Stage 3.: Finishing up, commiting
Once the discussion on the refinements was set, I started working on better diagnostics messages. When a note says “Assuming x is greater than 0” in a longer bug report, it may be confusing as to why we chose to explain that particular value. Shockingly, this process was also far more difficult than anticipated.
Some visitors are registered to describe a specific value, so providing them with a reason (that we’re describing this value because it caused a null pointer dereference, or that it’s “just” a condition) was as simple as adding another constructor parameter. However, some are more generic, leading to the idea of creating new interestingness kinds, enabling a visitor to retrieve a reason during the inspection of interesting values in an ExplodedNode.
In order to make sure that this new system was preserved, I refactored a lot of code, disallowing the analyzer to modify the interestingness sets after the visitors finished their work.
Finally, I made one last analysis on several projects, shared the results, and committed my work.
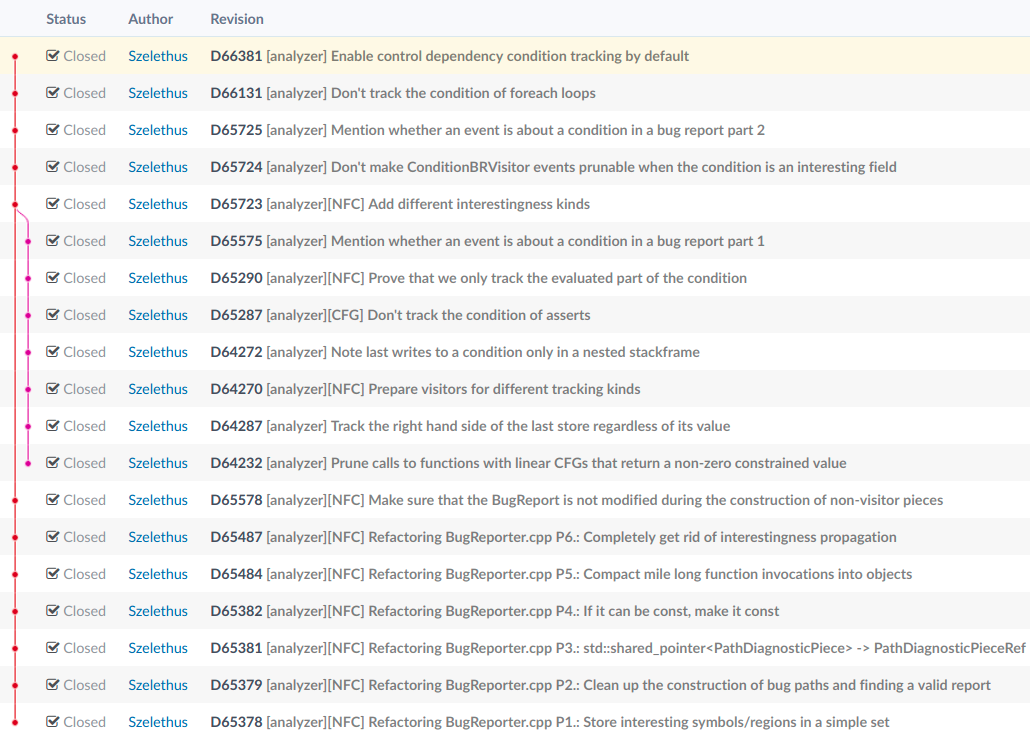
- D65378: [analyzer][NFC] Refactoring BugReporter.cpp P1.: Store interesting symbols/regions in a simple set
- D65379: [analyzer][NFC] Refactoring BugReporter.cpp P2.: Clean up the construction of bug paths and finding a valid report
- D65381: [analyzer][NFC] Refactoring BugReporter.cpp P3.: std::shared_pointer
-> PathDiagnosticPieceRef - D65382: [analyzer][NFC] Refactoring BugReporter.cpp P4.: If it can be const, make it const
- D65484: [analyzer][NFC] Refactoring BugReporter.cpp P5.: Compact mile long function invocations into objects
- D65487: [analyzer][NFC] Refactoring BugReporter.cpp P6.: Completely get rid of interestingness propagation
- D65578: [analyzer][NFC] Make sure that the BugReport is not modified during the construction of non-visitor pieces
- D64232: [analyzer] Prune calls to functions with linear CFGs that return a non-zero constrained value
- D64287: [analyzer] Track the right hand side of the last store regardless of its value
- D64270: [analyzer][NFC] Prepare visitors for different tracking kinds
- D64272: [analyzer] Note last writes to a condition only in a nested stackframe
- D65287: [analyzer][CFG] Don’t track the condition of asserts
- D65290: [analyzer][NFC] Prove that we only track the evaluated part of the condition
- D65575: [analyzer] Mention whether an event is about a condition in a bug report part 1
- D65723: [analyzer][NFC] Add different interestingness kinds
- D65724: [analyzer] Don’t make ConditionBRVisitor events prunable when the condition is an interesting field
- D65725: [analyzer] Mention whether an event is about a condition in a bug report part 2
- D66131: [analyzer] Don’t track the condition of foreach loops
- D66381: [analyzer] Enable control dependency condition tracking by default
Results
I ran the final version of my work on several large open-source projects, such as Tmux, Xerces, Protobuf, LLVM + Clang, CppCheck and Bitcoin.
Conclusion
I found that the new notes were entire function calls, so even if they didn’t describe anything of interest, they didn’t pollute the bug report much. The note messages were clear about whether they are describing a condition. On LLVM, out of 38 cases I evaluated, I found 2 reports that didn’t improve at all, yet they still remained readable, while the rest were far easier to make judgement on. Interestingly, most of the projects didn’t contain code that triggered the addition of notes coming from my work.
Examples
Example 1.: Assumption on a condition
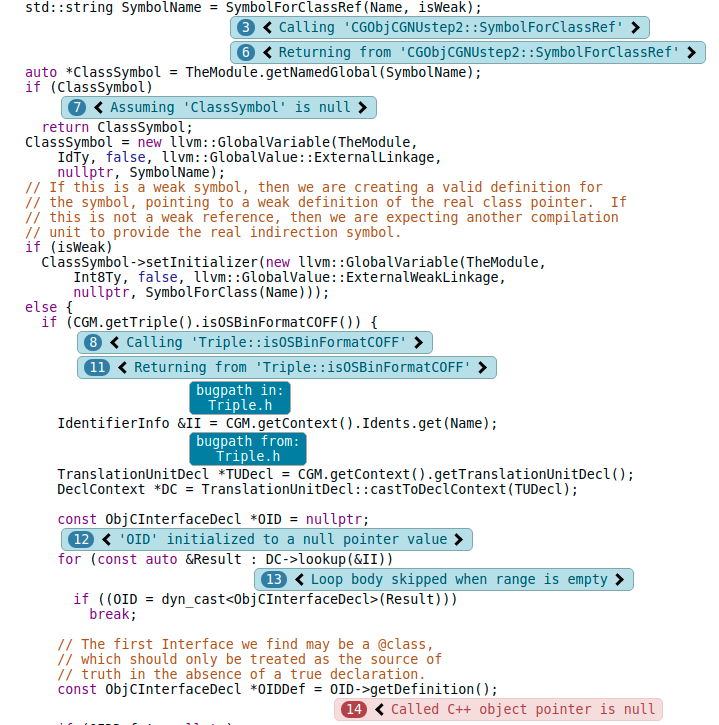
Observe that in the following bug report, the analyzer knows that isWeak is false, hence the lack of note saying “Assuming isWeak is false”, yet it doesn’t explain why it believes this, despite if it was true, the bug would not have occurred.
We can see that after control dependency condition tracking, the analyzer explains a function call to CGObjCGNUstep2::SymbolForClassRef.
After inspecting that function, we can see where the assumption on isWeak originates from.
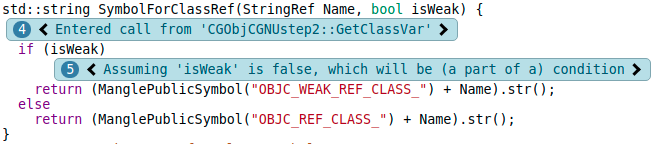
It so happens that this report is a false positive, but the path of execution is better explained.
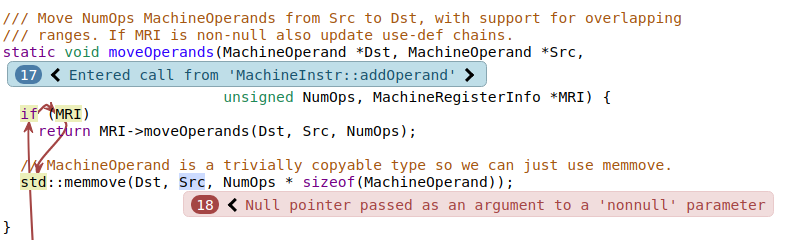
Example 2.: Condition value from a function
In this bug report, we can see that Src was assumed to be a null pointer, and was passed to a function that expects a nonnull parameter. The particularly interesting thing here is that there is no note placed at if (MRI), which means that the analyzer knew its value, and did not assume.
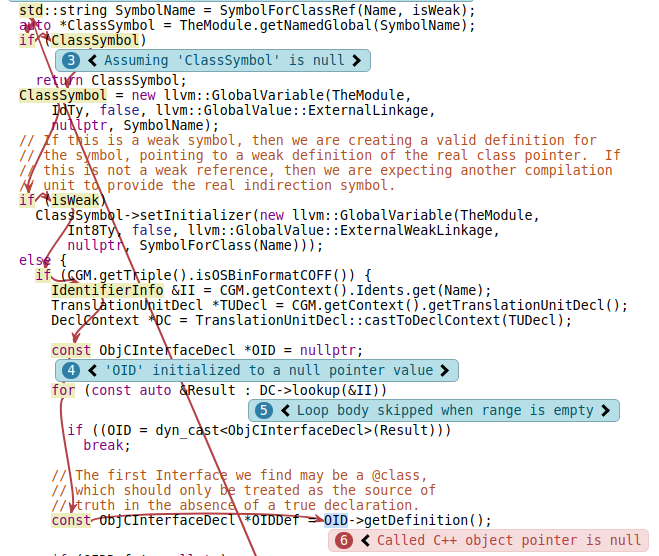
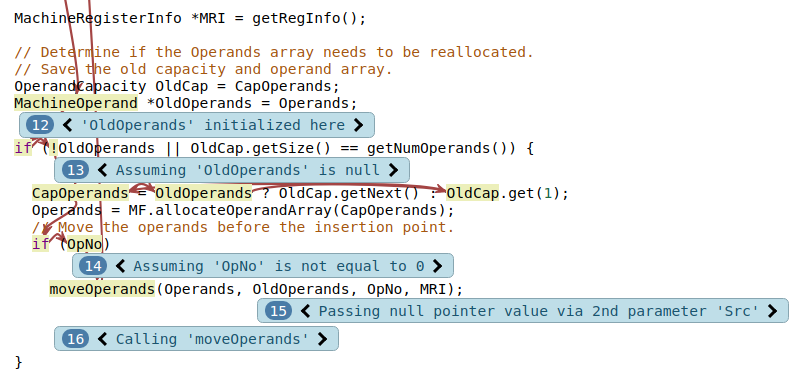
On this part of the bug report, we can see the code that initialized MRI and called the function in which the bug was found, yet it isn’t obvious at all why MRI would be known to be null.
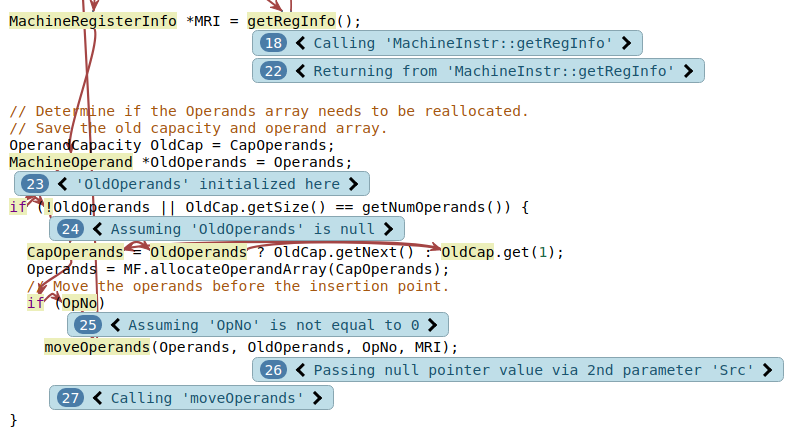
Enabling control dependency condition tracking adds notes to the function call that is the initializer of MRI.
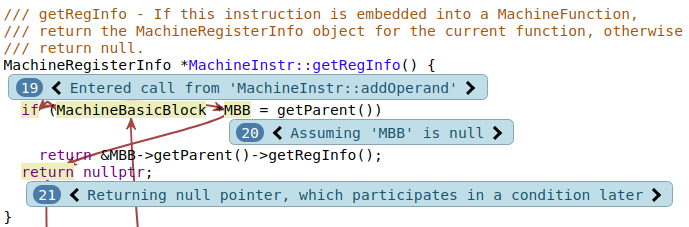
Inspecting this function shows that it wasn’t guaranteed that it will return a null pointer, yet in this case it does. This is a good example of previously hidden information that is relevant to the bug report being displayed for the first time.
Future work
Arguing about unexplored parts of the code
Tracking the conditions of control dependencies is an important milestone for bug report construction, though one still has to decide that which CFG blocks are important enough to describe its control dependencies. It was mentioned earlier that an obvious candidate for this is the block which is associated with the error node (because if control didn’t reach there, the bug would not have been discovered), but there are known cases where this isn’t sufficient.
Note how the test case shown in the problem statement still lacks explanation about the condition on line 12. This is a spectacularly more difficult problem to solve: while the bug would have been avoided if the condition was true, this may not always be the case. What if that condition only guarded a print statement? Since this part of the code isn’t contained in the bug path, our usual approach of writing visitors don’t work here.
ExplodedGraph traversal
There are a variety of approaches that may help on this, for example, instead of only arguing about the bug path, we may attempt to traverse the entirety of the ExplodedGraph. This solution unfortunately houses countless unknowns, which is why we concluded that it isn’t worth pursuing.
There’s no guarantee that the other path of execution is in any relation to the bug path, even if the particular part of the code we try to argue about is explored on it. Our way of constructing regions and symbols may also make this more difficult. It may also happen that the ExplodedGraph doesn’t talk about that part of the code at all.
However, there are potential benefits to it as well: the solution would be interprocedural out of the box. The development of an ExplodedGraph traversal interface could allow other types of analysis as well, such as a better false positive suppression algorithm, improvements on bug path shortening and deduplication.
Reaching definitions analysis
A definition of a variable is a statement that potentially assigns or initializes it. In a CFG, we say that definition D reaches the statement S if there’s a path from D to S such that D isn’t killed on this path. A definition of the variable x is killed if there is any other definition of x along this path.
For example, when talking about reaching definitions to x in statement S, D1 doesn’t reach S, because D2 kills it. D2 and D3 however do reach S.
void f() {
  int *x; // D1

  x = 0; // D2

  if (flag)
    x = new int; // D3

  *x = 5; // S
}
This algorithm presents an immediate and simple solution to this problem, but houses several downsides as well. Since it’s defined on the CFG, it is intraprocedural. Also, a definition of a variable is far harder to define for C++ due to aliasing, (potentially virtual) methods, inheritance, etc.
Making this algorithms interprocedural is difficult due to complex rules around parameter passing for functions in C++. However, complimenting this algorithm with the visitor infrastructure allows us to reason about the entire body of a function otherwise visited by the analyzer.
Reaching definitions could also be useful for other things, such as custom visitors for checkers.
However, while we put very serious research effort into this, development is still at a very early stage, and might even take several months to finish.
Discussion:
- [cfe-dev] [analyzer] Rough sketch of the algorithm for “Enhancing bug reporting with static backward program slicing”
- [cfe-dev] [analyzer] Discovering information not contained in the bugpath
- [cfe-dev] [analyzer] Speaking about reaching definitions…
- [cfe-dev] [analyzer] Using reaching definitions analysis for bug report construction
Implementation
- D65196: [CFG] Introduce CFGElementRef, a wrapper that knows it’s position in a CFGBlock
- D64991: [analyzer][WIP] Implement a primitive reaching definitions analysis
Condition-based false positive suppression
We employ several false positive suppression techniques on tracked variables, but decided not to use them for the freshly tracked conditions to focus on the accuracy of the new system.
Take the following code snippet as an example:
01 void check(int b) {
02   if (b)
03     ;
04 }
05
06 void f(int b) {
07   check(b);
08   (void)(10 / b);
09 }
The analyzer takes a conservative approach on symbolic values, and won’t assume b to be 0 unless the code itself eludes to the fact that its value may be 0. In this case, the analyzer sees that b in function f has the same value as b in check, and that the code checks whether its value is 0, so it will explore a path of execution on which b is 0, and one where it isn’t. However, even after finding a division by zero error on line 8, the report will be suppressed.
Just like false positives for regular analysis, suppression techniques like this will result in some false negatives, though evidence suggests that using them results in a better overall experience.
We suspect that using the same rigorous algorithm might get rid of too many true positive results, experimenting with a condition value based suppression technique would further increase the accuracy of reports.